Assignment 8
Due date: November 13, 2025 at 11:59 pm.
Be sure to use version control git, as you develop your script. Do git add and git commit repeatedly as you add to your script. You will hand in the output of git log for your assignment repository as part of the assignment.
Data
For this assignment, let us again consider the histogram that we created as part of Assignment 5.
    >
> source("../assignment5/Broccoli.Utilities.R")
>
> n <- 10
> result <- sapply(rep(n, 1000), pass.the.broccoli)
>
> hist(result[1,], breaks = 40)
>
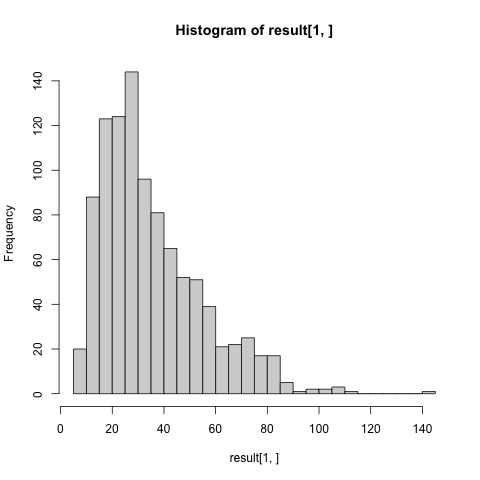
As you can see, this distribution is neither symmetric nor Gaussian. As such, the mean value is not the most-probable value. If we're interested in the most-probable value (the 'mode', see lecture 10, slide 13), or getting confidence intervals on this value, we will need to use bootstrapping.
Problem
As usual, create a utilities file to contain your functions.
1a) Create a function which, given a vector of discrete numeric values, will return the most-probable value. If there are multiple values with equal probabilities, return the smallest of the most-probable values.
Note that the mode function that comes with R does not return the 'mode' in the sense of lecture 10, slide 13. Write your own!
1b) Create a function which will take a vector of numeric values, and an integer k, as arguments. The function will perform non-parametric bootstrapping on this data, with k replicates, calculating the most-probable value of the data set. The function should return the output of the boot command.
1c) Create a function which takes three integers as arguments. The first argument will indicate the maximum number of pass-the-broccoli players to evaluate, nmax; the second will be the number of bootstrap iterations to run, k; the third will be the number of times pass-the-broccoli will be played in the original data set, m. For each value of n, between 10 and nmax (inclusive), the function should
- use an apply function to play pass-the-broccoli
mtimes. The data set we will consider is the number of times the broccoli was passed, each game, not the winner of the game, - apply non-parametric bootstrapping to the above generated data set, using
kreplicates, with the most-probable value as the test statistic, - determine the most-probable value of the test statistic, as calculated by bootstrapping, as well as the upper and lower 95% confidence intervals calculated using the "normal" algorithm.
The final most-probable value, upper and lower 95% confidence values, for each value of n, should be returned.
Your driver script should perform the following steps.
- It should take a single command line argument, indicating the value of
nmaxto evaluate. - It should perform non-parametric bootstrapping, with 1000 replicates, on 2000 iterations of pass-the-broccoli.
- It should plot the value of the test statistic versus
n. On this plot it should also add the upper and lower 95% confidence interval.
Some notes to follow when implementing your script:
- You will need to source
Broccoli.Utilities.R. Do NOT source it as on this page, up above. Copy your Assignment 5Broccoli.Utilities.Rto your Assignment 8 directory, and source it there. (If your code for 1a and 1b of Assignment 5 did not work properly, fix it!). If you source it as above your code will likely not work for the graders and you will lose marks. - Be sure to defend your command line argument for your driver script against all possible failure modes.
Submit your Broccoli.Utilities.R, new utilities file, driver script and the output of git log from your assignment repository.
To capture the output of git log use redirection, git log > git.log, and hand in the git.log file.
Assignments will be graded on a 10 point basis. Due date is November 13th, 2025 at 11:59pm, with 0.5 point penalty per day for late submission until the cut-off date of November 20, 2025 at 12:00pm.