Assignment 9
Due date: Thursday, March 27th at midnight (Thursday night).
0) Be sure to use version control ("git"), as you develop your code. We suggest you create a new directory to hold this assignment, "assignment9" for example, and initialize a new git repository within it.
$ mkdir assignment9
$ cd assignment9
$ git init
Do "git add ...., git commit" repeatedly as you add to your scripts. You will hand in the output of "git log" for your assignment repository as part of the assignment. You must have a significant number of commits representing the modifications, alterations and changes in your scripts. If your log does not show a significant number of meaningful commits you will loose marks.
This assignment will explore the Capture-recapture technique of estimating wildlife populations. Suppose we are estimating the population of a specific species of fish in a lake. This technique involves capturing a sample of the fish, tagging the fish so that they now have markers, releasing the fish back into the lake, and then, once the tagged fish have sufficiently spread thoughout the lake, returning to the lake and capturing a second sample of fish. Based on the number of previously-tagged fish in the second sample, the population of the fish in the lake can be estimated.
We will examine a variation on this technique known as inverse sampling capture-recapture. Let us assume that there are \(N\) fish in a given lake, and we have tagged \(M\) of them. This technique estimates \(N\) by counting the number of fish that need to be caught to catch \(m\) previously-tagged fish. If the number of fish that need to be caught is \(Y\), then \(N\) can be estimated using the equation $$\hat{N} = \frac{MY}{m}$$
We will perform a simulation of this type of population estimation, and examine the distribution of the estimates of the population of fish.
1) Create a file named Capture_Recapture_Utilities.py. It will contain the functions described in part 1 of the assignment. Note that, for the functions listed below, you will need to determine for yourself what arguments the functions need.
1a) Create a function called tag_population. This function will randomly pick \(M\) fish to be tagged out of the total population of \(N\) possible fish. The same fish may not be tagged twice. The function should return the indices of the tagged fish. The numpy.random.choice function might be useful here.
1b) Create a function called catch_fish. This function will randomly catch fish from the lake until \(m\) previously-tagged fish have been caught. Note that the fish are thrown back into the lake after each has been caught. Your function should use a population of tagged fish to determine if a tagged fish has been caught, not just a probability of catching a tagged fish. The function will return the number of fish that had to be caught, \(Y\), to catch the \(m\) fish.
1c) Create a function called calc_N. This function will return an estimate for \(N\). Note that \(N\) should be an integer.
1d) Create a function called simulate_pops. The function will perform the following steps:
- randomly generate a tagged fish population,
- calculate the number of fish it takes to catch \(m\) previously-tagged fish,
- estimate and return \(N\) using this data.
Your functions should behave similar to this:
  >>>
  >>> import Capture_Recapture_Utilities as cru
  >>>
  >>> tagged_pop = cru.tag_population(100, 10)
  >>>
  >>> tagged_pop
  array([54 59 84 49 24 33 64 74 50 41])
  >>>
  >>> cru.catch_fish(tagged_pop, 100, 5)
  60
  >>>
  >>> cru.calc_N(10, 60, 5)
  120
  >>>
2) Create a script, named Run_Capture_Recapture.py, which:
- imports the file "Capture_Recapture_Utilities.py"
- reads three arguments from the command line. These arguments are \(N\), \(M\) and \(m\). Use the 'argparse' package to read these arguments.
- runs
simulate_pops1000 times with the values of \(N\), \(M\) and \(m\). - creates a normalized histogram of the estimated values of \(N\). Use the
plt.histcommand to do this, and useplt.savefigto save your histogram. - If the command-line arguments are not numeric the script should exit with an appropriate error message.
- If the values of the command-line arguments do not make sense the script should exit with an appropriate error message.
- If the number of command-line arguments is not 3 the script should exit with an error message.
An example of your histogram, for \(N=1000\), \(M=100\) and \(m=100\), might look like this, where a distribution has been added to the plot (you do not need to add a distribution to your plot). This is an example of negative binomial distribution. 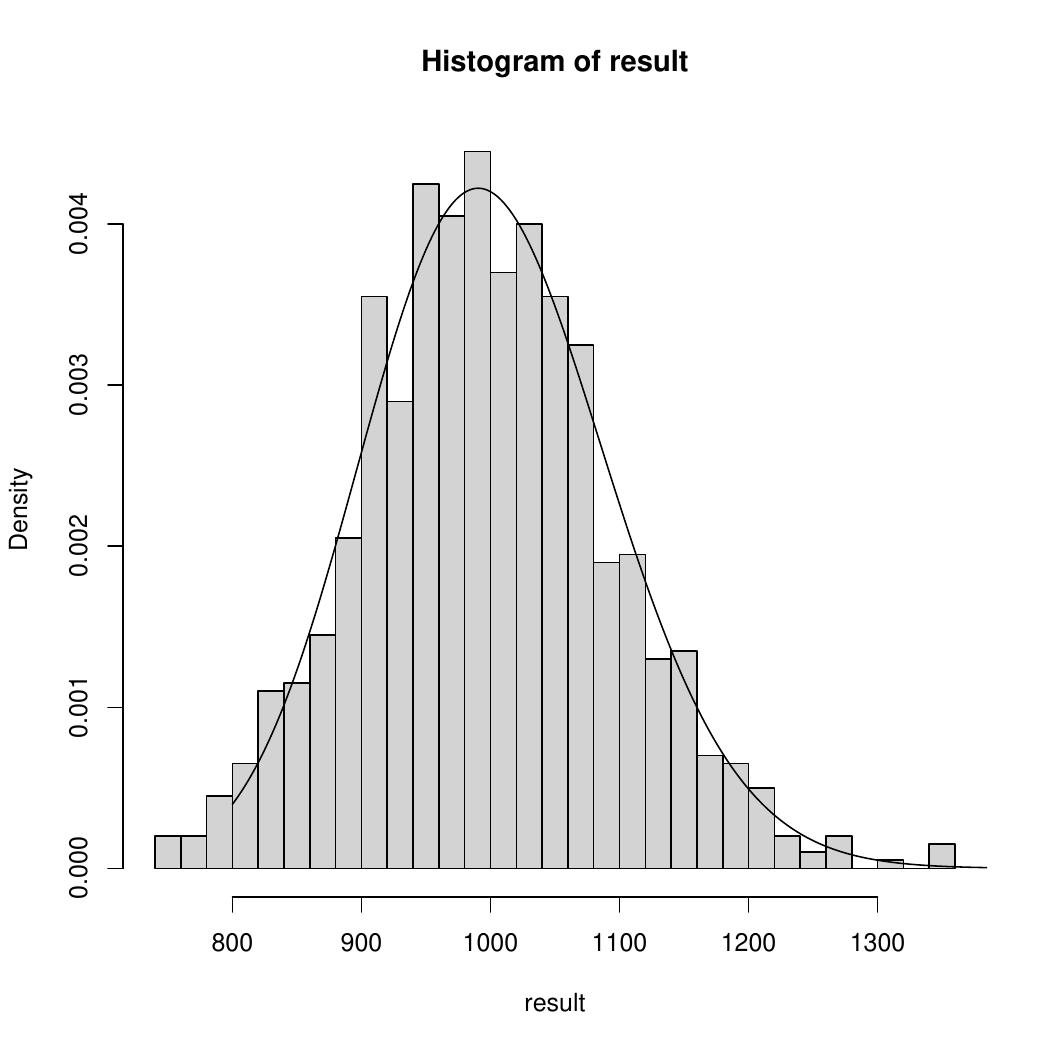
Submit your Capture_Recapture._Utilities.py, Run_Capture_Recapture.py, your histogram figure and the output of "git log" from your assignment repository.
Your Python code must be added and committed frequently to the repository. To capture the output of 'git log' use redirection ( git log > git.log, and hand in the "git.log" file).
Assignments will be graded on a 10 point basis. Due date is March 27th 2025 (midnight), with 0.5 point penalty per day for late submission until the cut-off date of April 3rd 2025, at 10:00am.