Assignment 11
Due date: Thursday, April 7th at midnight. Note that late assignments will not be accepted!
Be sure to use version control ("git"), as you develop your code. Do "git add ...., git commit" repeatedly as you add and edit your code. You will hand in the output of "git log" for your assignment repository as part of the
assignment.
One place clustering can appear is in compression applications. If a data set's rows can be represented by cluster centres then the amount of information needed to store the data is significantly reduced. This, of course, is a "lossy" form of compression, meaning that information is lost in the process.
The goal of this assignment is to apply k-means clustering to a photo to reduce the number of bits needed to store the photo. This will be done by running k-means on the photo's data, finding the number of cluster centres that will contain most of the photo information, recasting the photo's data back onto the cluster centres for each pixel, and then saving the resulting photo. Note that, by doing the actual conversion back into a form that can be used to display the photo the compression is lost.
1 Create a file, called kmeans_utilities.py, which contains the following functions.
1a) Create a function which takes a single argument, a filename. This function will read in the image associated with the filename, convert it to a numpy array, and "flatten" the array. This means that if the array has a shape of (X, Y, 3), then the flattened array will have a shape of (X * Y, 3). Image files always have 3 entries in the final dimension, one for each colour. The function will return the flattened array and the shape of the original image.
There are several packages available that will read JPEG images. I used matplotlib.image's imread function, but you may use any function you like.
1b) Write a function that takes 2 arguments: the flattened data and kmax, the maximum number of cluster centres we will analyze using cross-validation. The function will perform 10-fold cross-validation on the data, testing different k values ranging from 1 to kmax, for a k-means model. The average scores for all of the k values will be saved and returned as a vector.
1c) Write a function that takes the cross-validation scores as its argument. In class we eye-balled what value of k was best, to choose the number of clusters to keep in our model. We would like to automate this process. This function should shift the cross-validation scores so that the minimum score now has a value of zero. Using these shifted scores, determine the minimum value of k that should be kept, such that the cross-validation score is at least 95% of the maximum cross-validation score. The function should return this value of k.
1d) Write a function that will take the flattened data and a trained k-means model as its arguments. It will predict each data point's closest cluster centre (using the predict function) and assign the centre's value to those data points. It will return this modified data.
2) Create a Python script, named run_kmean_image.py, which:
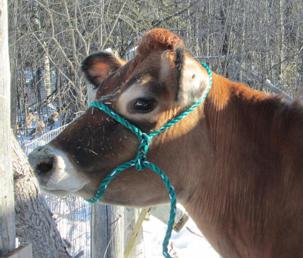
- Reads in the photo of Merry, the Spence family cow (you may hard-code this file name),
- runs 10-fold cross-validation on k-means models for values of k from 1 to 19 and gathers the average cross-validation scores (note that this step can take 5 minutes to run),
- determines the best value of k to use, which captures at least 95% of the maximum cross-validation score, and prints out a sentence announcing this value,
- builds a new k-means model using the best value of k,
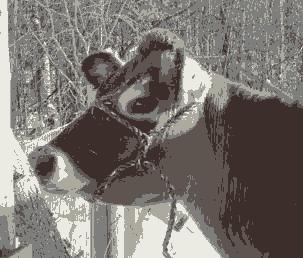
- creates a new version of the data, using the cluster centres as the data points for each pixel,
- unflattens and saves the resulting data as a JPEG image. I used the
matplotlib.pyplotimsavefunction.
The image you should test your code on is this photo of the Spence family cow, Merry.

After the compression and image-rebuild your image will look something like this.

Submit your kmeans_utilities.py, run_kmeans_image.py, your converted image and the output of git log from your assignment repository.
To capture the output of 'git log' use redirection, git log > git.log, and hand in the "git.log" file.
Assignments will be graded on a 10 point basis.
Due date is April 7th, 2022 at midnight. Late assignments will not be accepted.
