Assignment 5
You must use version control (git), as you develop your scripts. Start by creating a new directory and use the following commands to initialize the git repository
$ mkdir assignment5
$ cd assignment5
$ git init
Perform git add and git commit repeatedly as you add code to your scripts. You will hand in the output of git log for your assignment repository as part of the assignment. You must have a significant number of commits representing the modifications, alterations and changes in your scripts. If your log does not show a significant and meaningful number of commits, with detailed comments describing your changes, you will lose marks.
Description
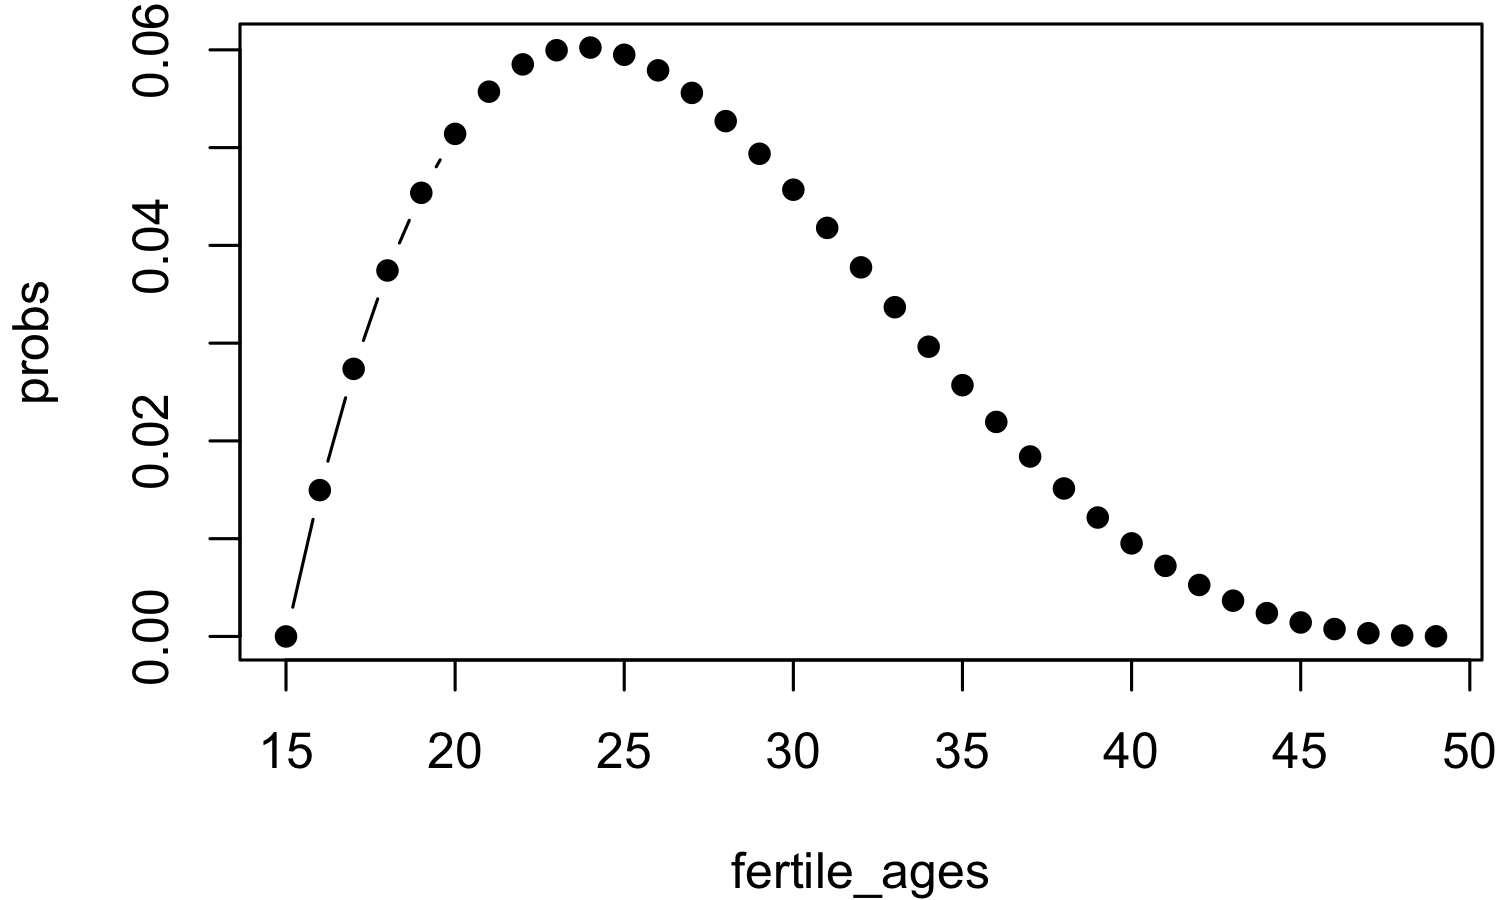
For this assignment we will be developing a crude population evolution model. Statistics Canada defines the Total Fertility Rate as the number of children that a hypothetical female would have over the course of her reproductive life if she experienced the age-specific fertility rates observed in a given calendar year. We can model this age-specific fertility rate using a beta distribution. If we take a woman's reproductive years to be, as per Statistics Canada, 15-49, then we can generate a probability distribution using the following commands.
>
> fertile_ages <- 15:49
> n_fertile_ages <- length(fertile_ages)
>
> probs <- dbeta((fertile_ages - min(fertile_ages)) / n_fertile_ages, 2, 4) / n_fertile_ages
>
> print(sum(probs))
[1] 0.9986399
>
> plot(fertile_ages, probs)
>

Note that the sum of the probabilities is about one, as it should be for a standard probability distribution. However, since the total fertility rate, for a hypothetical woman, is generally not one this distribution will need to be scaled to the correct fertility rate when used below. The Canadian Total Fertility Rate for the last few years can be found here.
1) Create a file named Fertility.Utilities.R. It will contain the functions described in part 1 of the assignment.
1a) Create a function called create.probs, which takes a single argument, the total fertility rate. This function will create and return a data frame which contains the probabilities that a woman of a given age will have a child in a given year, for the ages 15-49. It should also return the years associated with those probabilities.
1b) Create a function called create.pop, which takes a single argument, n, the initial number of people in our population. This function will calculate and return a data frame containing the initial numbers of males and females in the population, as a function of age. The population will be evenly distributed between males and females and all ages, 0-70 inclusive.
1c) Create a function called calc.births. This function will take two arguments, the data frame of fertility probabilities and the data frame containing the population. The function should randomly calculate, using the fertility probabilities, for all females of reproductive age, the number children born that year. The sample function will be useful here, noting that the probabilities used in that function are modified using the prob argument. Once the number of children born has been determined, the number of male and female children must also be randomly determined. Assume that the probability of being born male or female is equal. The function should return a list containing the number of males and females born that year.
1d) Create a function called evolve.population. This function will take three arguments, the data frame of fertility probabilities, the data frame containing the initial population, and the number of years that the population will be evolved. The function should iterate over the number of years. Each year it should
- calculate the number of births for that year,
- add the new births to the population data frame,
- increment the ages of all the people by one year,
- remove all seventy-one-year-olds (we will assume everyone dies at this age).
Part 2
Write an R script, called population.evolution.R, which performs the following steps.
- Receives an argument from the command line indicating the total fertility rate of the population. This argument should be defended, meaning the code should confirm that this argument is a number. The
as.numericandis.nafunctions can be useful here. It should also make sure that the total fertility rate is positive, and exit cleanly if not. - Creates a data frame containing the fertility probabilities for the given total fertility rate.
- Creates a data frame containing the initial population distribution, for a population of 1000.
- Evolves the above population for 100 years.
- Creates a plot of total population versus year, for the evolved population. Note that when run from the command line this plot will automatically be saved in a file called Rplot.pdf. This is fine.
Note that, starting with this assignment and for the rest of the semester, you will be expected to use coding best practices in all of the work that you submit. This includes, but is not limited to:
- The number of command-line arguments is defended in your driver script.
- Plenty of comments in the code, describing what you have done.
- Sensible variable names.
- Explicitly returning values, if the function in question is returning a value.
- Not using the print() function to return values.
- Proper indentation of code blocks.
- No use of global variables.
- Using existing R functionality, when possible.
- Creating modular code. Using functions.
- Never copy-and-pasting code!
Submit your Fertility.Utilities.R and evolve.population.R scripts and the output of git log from your assignment repository.
To capture the output of git log use "redirection": git log > git.log, and hand in the git.log file.
Assignments will be graded on 10 points basis.
Due date is February 17th 2022 (midnight), with 0.5 point penalty per day for late submission until the cut-off date of February 24th, 2021, at 11:00am.
